This week’s Sunday Funday challenge by David Cowen is on SRUM forensics. The challenge states:
The Challenge:
Daily Blog #716: Sunday Funday 1/12/25
With so many of us relying on SRUM for so many different uses its time to do some validation on the counters so many people cite. For this challenge you will test and validate the following SRUM collected metrics and document if they accurately capture the data or if there is a skew present.
Use cases to test and validate on Windows 11 or Windows 10 but you must document which:
1. Copying data between two drives using copy and paste (look for disk read and write activity )
2. Uploading data to an online service of your choice (look for process network traffic)
3. Wiping files (look for disk read and write activity)
So let’s get started!
For this test I will be using Windows 11 24H2 and the times in my data generation are in AEDT (UTC+11). The times in the output are in UTC.
Data generation
Copying between two drives using copy and paste
For this test I created a virtual disk and a large file full of garbage. The disks were 2GB each and the file was 750MB (786,432,000 bytes on disk).
At 21:11 I copied the file and pasted it into the vhdx that was mounted.
Uploading data to an online server
At 21:15 I uploaded the same 750MB file with Google Chrome up to Google Drive. To do this I made sure to not use Explorer and went from within Chrome using the New –> File Upload section within drive.google.com. I accidently killed that upload around 21:25 because I wiped the file…so I’m not going to expect this number to be close to accurate but it got most of the way there.
At 21:17 I also copied the same file into my OneDrive by copying the file using the copy command within a PowerShell window. The file finished uploading to OneDrive around 21:30.
Wiping files
Lastly I wiped my transfer file around 21:25, since I have a few copies of it!

I also installed Eraser and wiped the file in the virtual disk at 21:32. I chose to right click directly on the file and choose Erase (not sure if that will change any outcomes).

Analysis
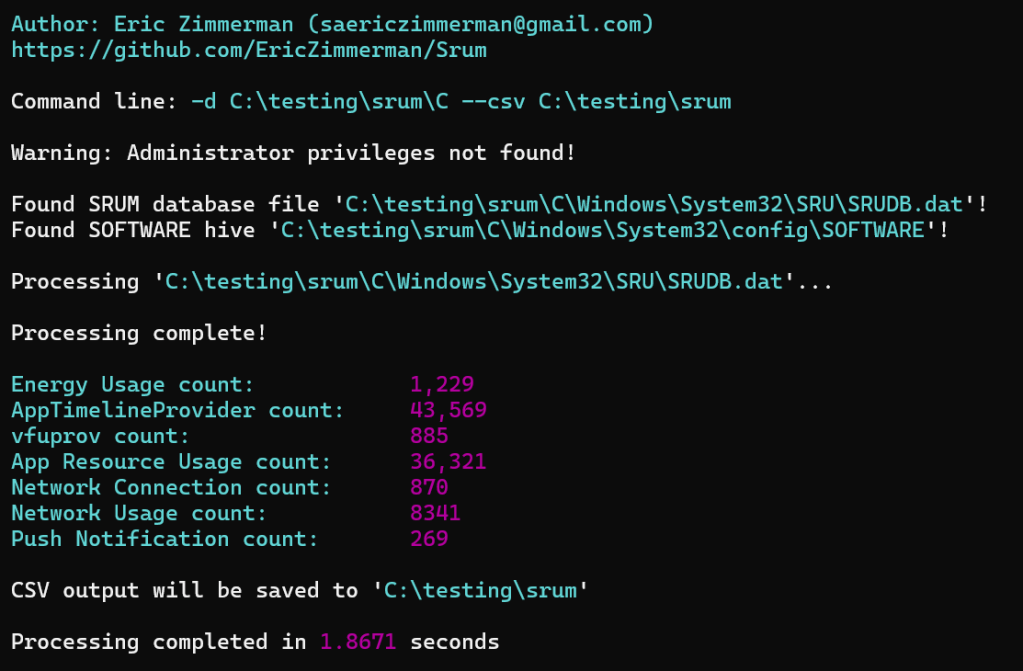
For analysis I chose to collect the data with KAPE, and I wanted to manually process it with a new fork of SRUMDUMP. This version is the same as current but it uses Dissect’s ESE module instead of libese.
After reparing with esentutl I found both current versions of Srumdump (libese and dissect) didn’t like the database, but srumecmd worked just fine! I haven’t looked at why they didn’t like it yet (but interestingly the new .net v9 srumecmd didn’t like it either).

For the analysis I decided to upload the data to Azure Data Explorer. Firstly it’s free, secondly it’s fantastic for quick data analysis.
I uploaded the output of srumecmd into separate tables; only AppResourceUseInfo, AppTimelineProvider, NetworkConnections and NetworkUsages.
Data copy
For data copy I grabbed the Explorer.exe process and the AppResourceUseInfo table (I didnt realise the ingest thought one of the fields was a timestamp instead of a long, so had to convert it). Here we can see that there was around 750MB (almost exactly the right number of bytes) written by the Explorer process, which tracks with the activity. Interestingly it doesn’t track the bytes read?

Data transfer
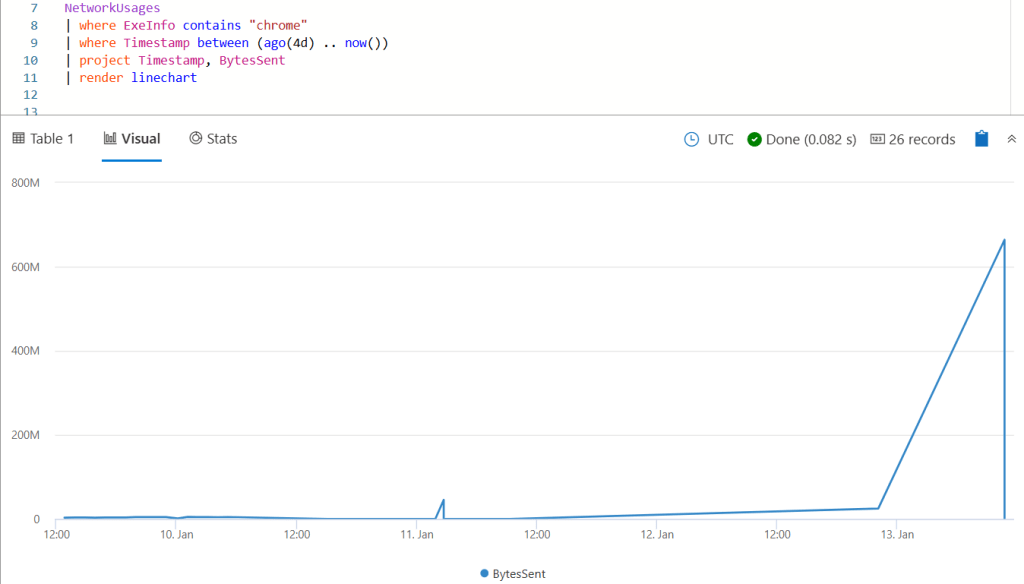
ADX is really great for this type of analysis because of the simplicity of the graphing features. Unfortunately I dont use this computer enough to graph with more granularity but you can see the spike pretty easily when filtering for BytesSent with Chrome.exe. The activity itself was recorded with a timestamp of 2025-01-13T10:43:00Z.

OneDrive shows similar activity with two events recorded at 2025-01-13T10:43:00Z, one being 144 bytes and the other being 883419280 bytes in the BytesSent column. This bytes sent is larger than the file but that is expected with whatever overhead OneDrive adds.

I’m still learning how to use ADX to it’s full potential, but you can do some cool stuff where you could summarise the transfer in discrete amounts and see whether there are spikes in network traffic.
Disk wiping
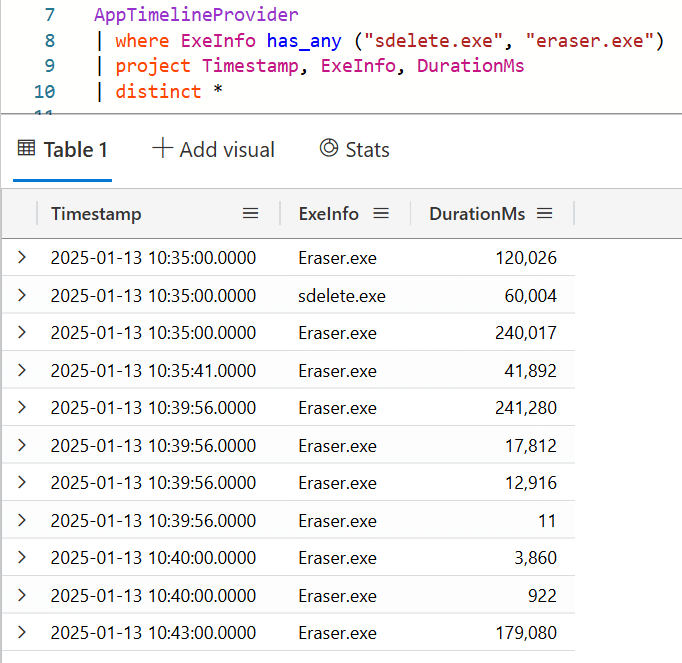
AppTimelineProvider shows both sdelete and eraser being run. I guess Eraser is still running in the background so that won’t really help us show that it was used to wipe something.

In the underlying data Sdelete is referenced twice; I think I might have ran it twice (but only once to wipe the file)

Next I checked the AppResourceUsageInfo table for the same and interestingly sdelete did not show up. Eraser showed up, but the bytes read was 0 and written was definitely not 750MB. That’s a bit confusing.

(The timestamps in AppTimelineProvider are breaking my mind a bit because I dont know why there’s a few different ones, need to go back to my notes. The other tables are recorded per hour.)
Summary
Ok so what did we learn
- For some reason srumdump didnt like my database, but srumecmd worked fine.
- Transferring a file across volumes using Explorer gets tracked as ForegroundBytesWritten, but not bytes read.
- Uploading a file with Chrome or OneDrive gets recorded in NetworkUsages with a spike in BytesSent. Granted here I wasn’t really using my computer for much else so it really did stand out.
- Erasing a file with Sdelete gets tracked in AppTimelineProvider but not in the other tables. This table does not give sizes.
- Eraser was in AppTimelineProvider and AppResourceUsageInfo but it didn’t show much in relation to the data wiping which was weird. It would be hard to show from this alone that something was wiped.
So some stuff is consistent, some is not. Sounds consistent with my experience…

the net9 issue was fixed this morning. Both net6 and 9 will work fine now.
LikeLike
[…] ThinkDFIRSRUMday Funday! […]
LikeLike
[…] SRUMday Funday! […]
LikeLike